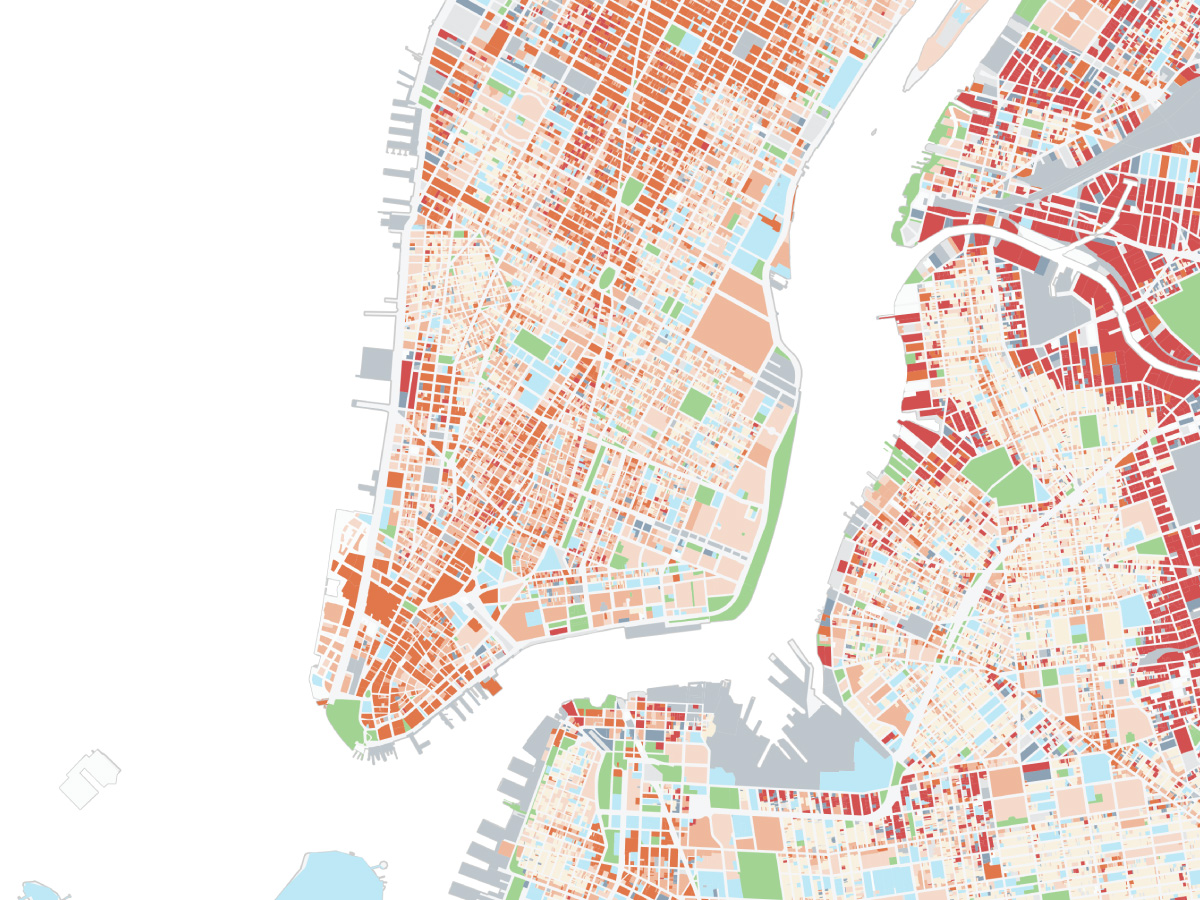
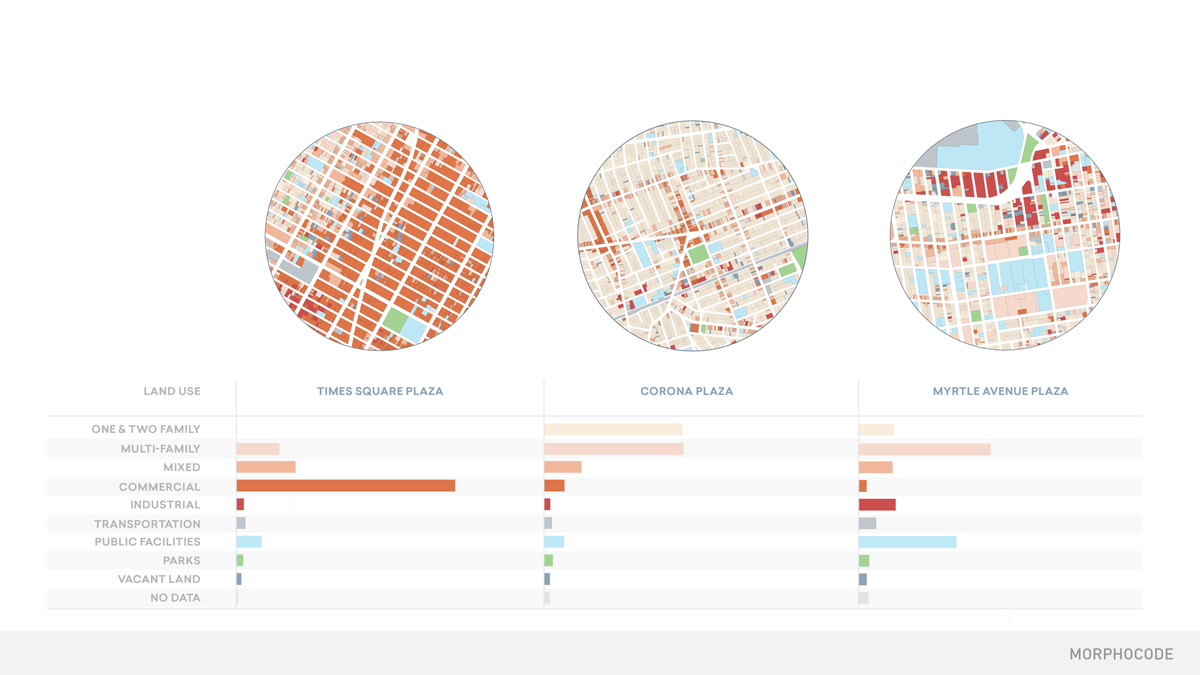
Online Video Course


Mapping Urban Data

Learn how to work with data, create web maps and explore urban insights.

The Course


Mapping Urban Data is a video course dedicated to exploring and visualizing data about cities.

In this course you will learn the fundamentals of working with data and creating web maps. You will go through the whole process of building an interactive web map: from urban data exploration and design principles to building the UI and adding interactivity with JavaScript.

The course will introduce you to key concepts and workflows through the topic of Land Use in New York City. It contains 30 carefully organized and beautifully illustrated videos that will lay a solid foundation to your mapping skills.

30 Full HD Videos

Over 4 hours of content available for streaming and download

Additional Resources

A curated list of additional resources for further reading

Project Files

Source code and completed project files

Free Updates

Unlimited free updates of the video content

Support

Ask questions and get help along the way

Practical Skills

Learn tools, workflows and best practices for mapping data

Students are entitled to a 30% discount off the course price. Learn More

Single User

$229
Get Course

EU customers: price excludes VAT

  • Work with data

    Learn how to handle open data sets and common data formats such as CSV, GeoJSON and Shapefiles. Work your way through data attributes, map features and GIS tools.
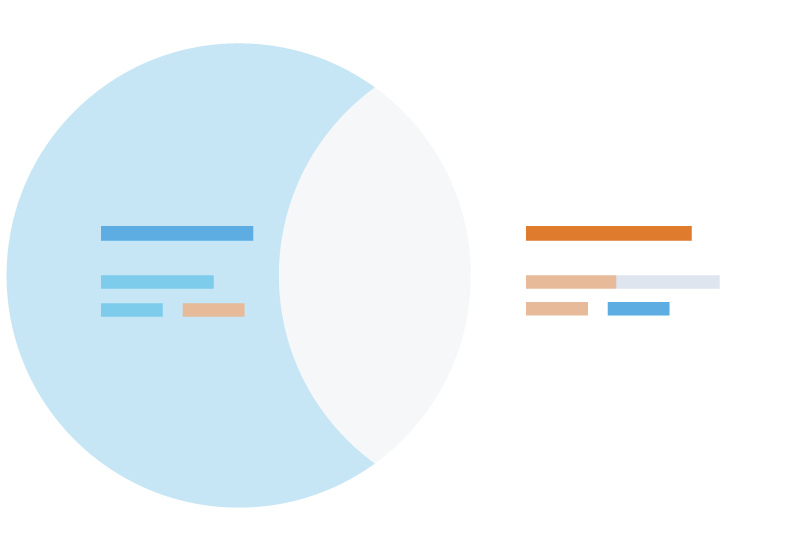
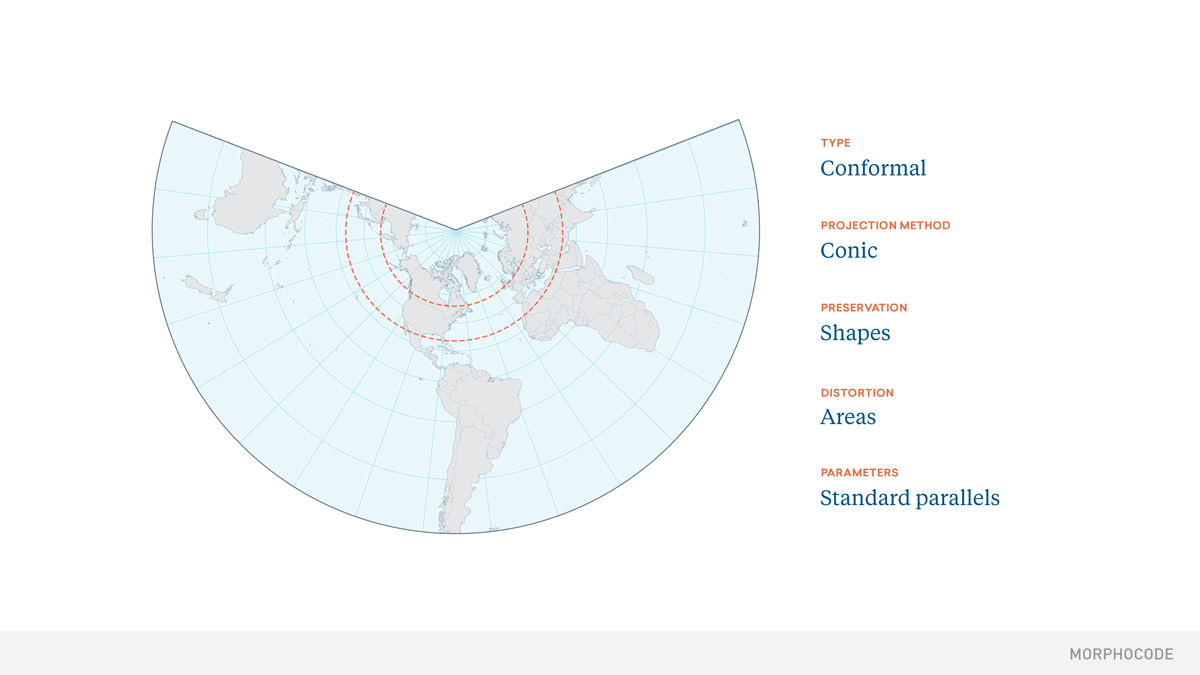
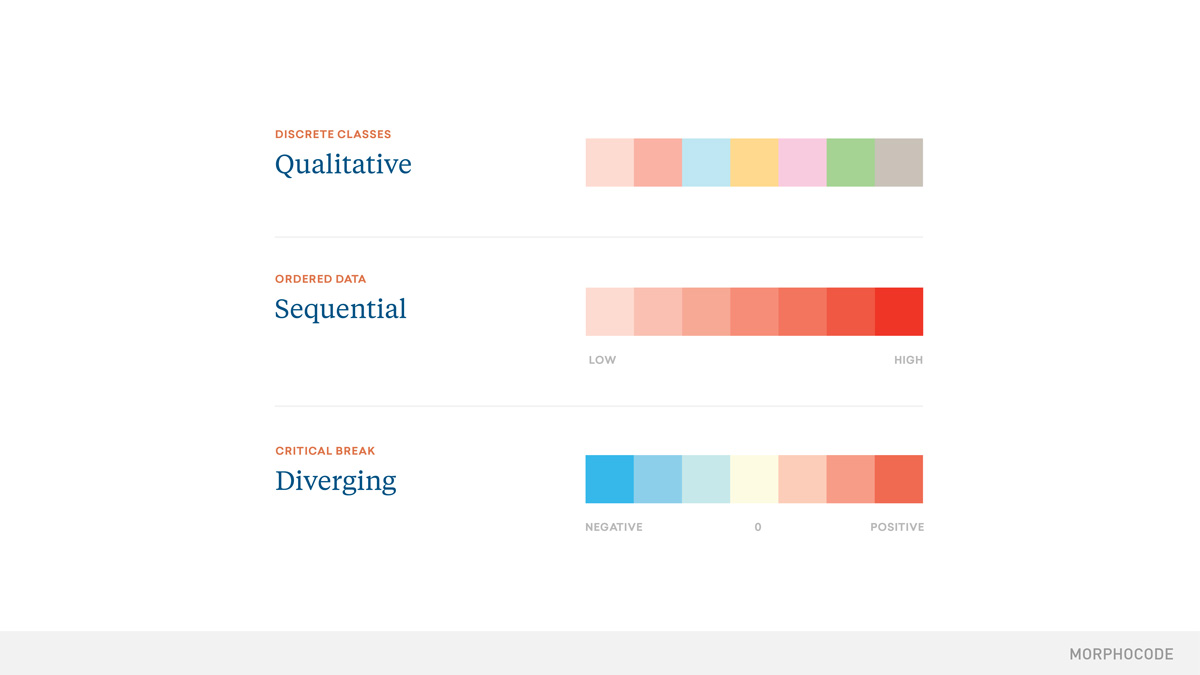
  • Design Principles

    Get familiar with core design principles and best practices in cartography and data visualization. Learn how to encode data with color and gain a better understanding of map perception.
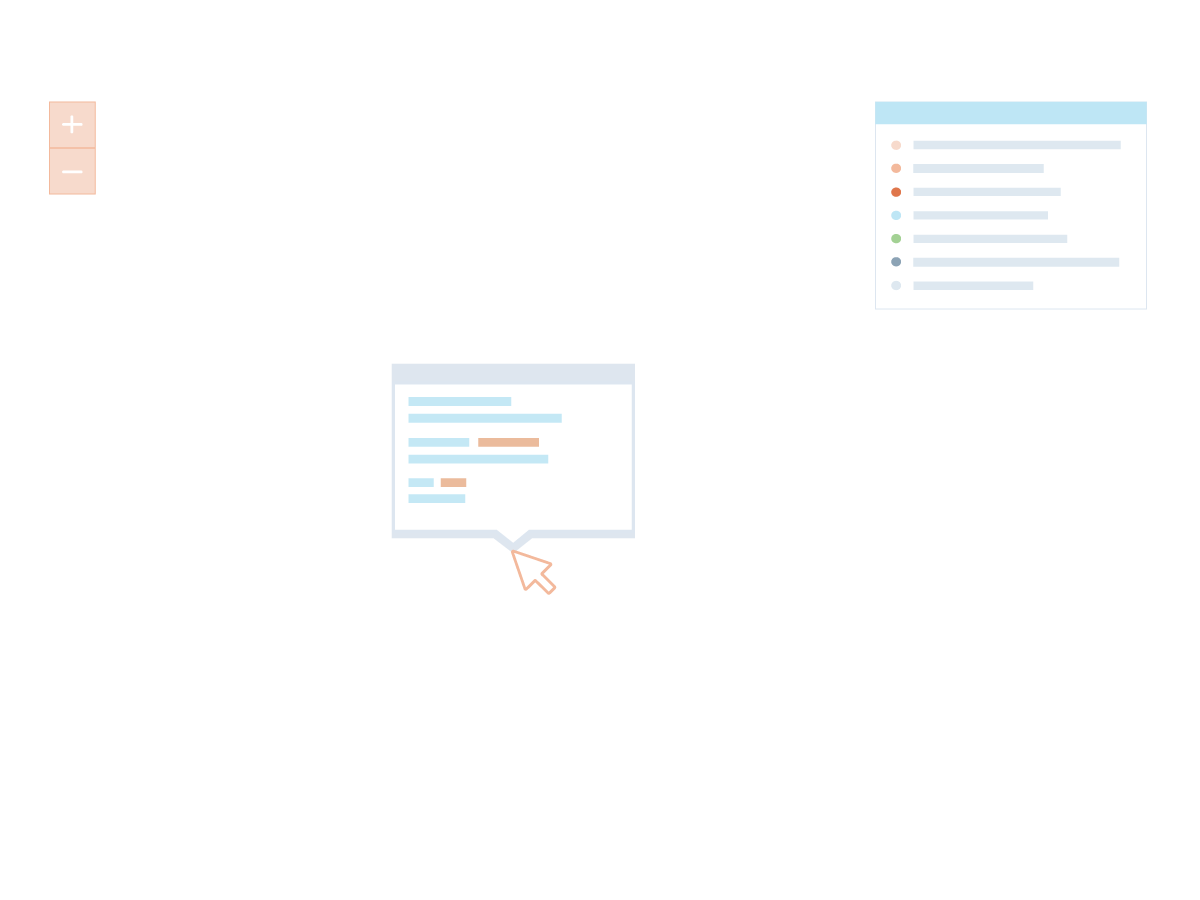
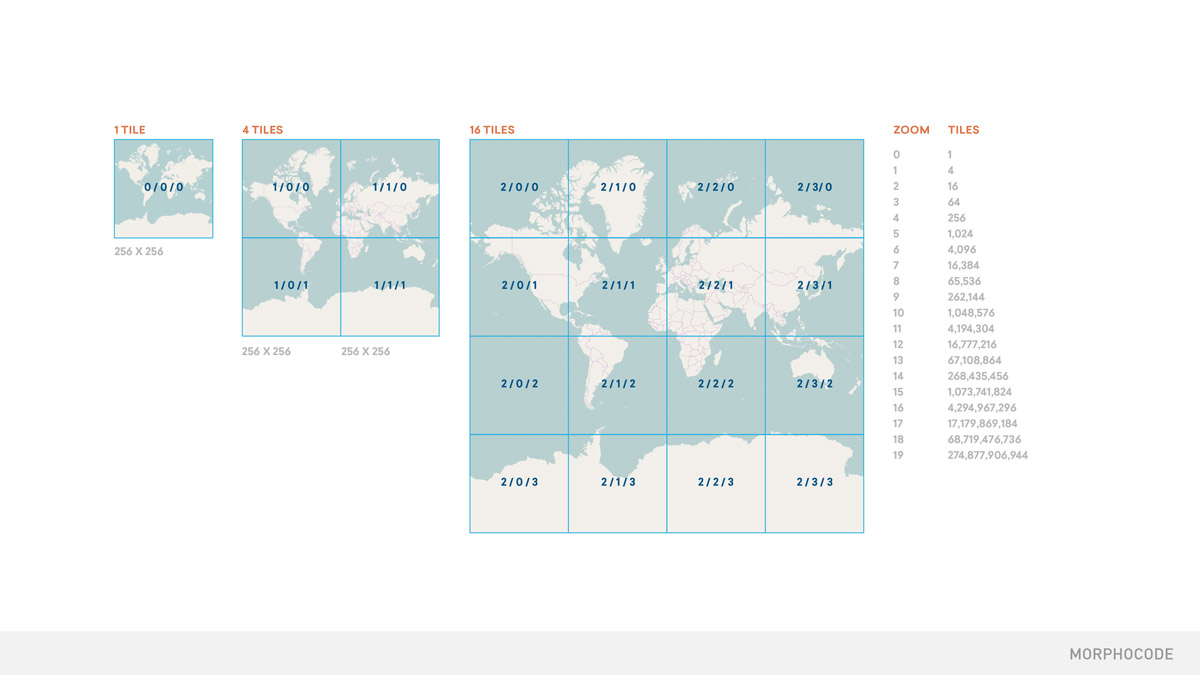
  • Web Mapping

    Bring your maps to the Web. Learn how tiled maps work, how to render the world into map tiles and what makes vector tiles a great choice for interactive web maps.
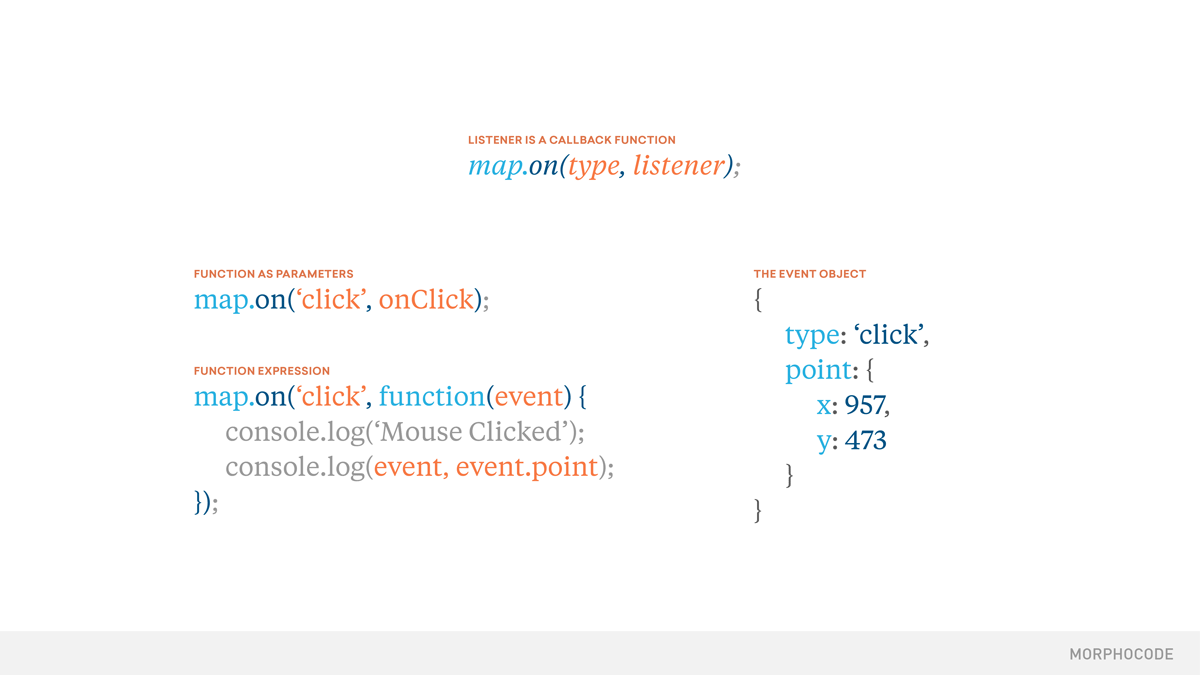
  • Coding

    Coding skills are essential for building dynamic data visualizations. Learn how to work with object structures, variables, expressions, methods and function listeners — all from a web mapping perspective.

The Fundamentals

Theory


The Fundamentals

The course covers the fundamentals of mapping urban data. You will start with a raw dataset, modify its attributes, design a map, add interactivity and publish the project on the web.

Along the way, we'll cover key concepts such as map projections, coordinate reference systems, attributes & features, data formats, tilesets, raster and vector tiles, data-driven styling and design principles.

Design, Interaction, Code

Practice


Design, Interaction, Code

We'll cover the process of designing the User Interface and adding custom map interactions by using HTML, CSS & JavaScript.

You will learn how Developer Tools, the Console API and element inspection work and you will build an interactive web map from scratch using Mapbox GL JS – a modern library for web mapping.

The Workflow


1
Story

Story

Land Use Mix,
Codes & Categories

2
Data

Data

Data exploration, File formats,
Coordinate Systems, Features

3
Map Design

Map Design

Color schemes, Perception,
Visual Variables

4
Web Mapping

Web Mapping

Tiled Maps, Vector Tiles,
Data-Driven Styling

5
UX

UX

UI, Interaction, HTML,
CSS, Javascript

6
Publishing

Publishing

Git, Github Pages,
Deployment

What's Inside


6
Modules
30
Videos
4
Hours
140
Slides

Videos

Each video breaks down a specific part of the workflow into discrete steps.
From common open data formats and cartographic fundamentals to writing JavaScript and deploying the map online using Git.

01. Getting Started

05:17
  • Welcome
  • Course Overview
  • The Workflow
  • Project Files

02. Land Use Mix

05:17
  • The importance of Land Use
  • Land use categories in NYC
  • Assigning Land use: Building Classes
  • Example: ZoLa map

03. Datasets

05:17
  • Working with Open data
  • Datasets & Data Formats
  • Shapefile, CSV, GeoJSON
  • Meta Data

04. Geospatial Data

14:17
  • Exploring geospatial data
  • Map Projections
  • Coordinate Reference Systems
  • Attributes & Features
  • New York State Plane & WGS84

05. MapPLUTO

08:22
  • MapPLUTO Overview
  • Key fields & attributes
  • Working with meta data
  • Editing datasets

06. Categorized Styling

03:22
  • Styling by Category
  • Color Ramps
  • Classification

07. Color in Maps

08:15
  • Visual Variables
  • Color Components
  • Data Types
  • Types of Color schemes
  • Map Accessibility

08. Land Use Colors

07:15
  • Design principles
  • Color palettes
  • Grouping categories
  • Styling map features

09. Web Maps

07:15
  • Web Mapping Fundamentals
  • Zoom Levels
  • Tiled Maps & Tiles
  • Raster Tiles

10. Vector Tiles

07:15
  • Vector Data & Tile formats
  • Map Interactivity
  • Raster vs Vector Tiles

11. Tilesets

07:15
  • Mapbox Studio Overview
  • Datasets, Tilesets, Styles
  • Generating tilesets
  • GeoJSON & WGS84

12. Style Editing

07:15
  • Working with map layers
  • Map Features & Styling
  • Creating the basemap

13. Data-driven styling

07:15
  • Working with Filters
  • Styling by attribute value
  • Styling the lot polygons

14. Zoom Functions

07:15
  • Layer types
  • Stroke & Opacity settings
  • Zoom Functions
  • Publishing the style

15. User Experience

07:15
  • Built-in Interactions
  • Custom Interactions & Layouts
  • Designing for Interaction
  • Interaction Examples

16. Web Development

07:15
  • Maps and the Web
  • HTML, CSS, JavaScript
  • Web Documents
  • Map Settings

17. User Interface

07:15
  • Building the UI Skeleton
  • HTML Elements & Attributes
  • Headings, Lists & Containers

18. Panel Styling

07:15
  • CSS properties & declarations
  • Inline styling
  • The Box Model
  • CSS Rules, selectors & stylesheets

19. Legend Styling

07:15
  • Adding color bullets
  • Typography & spacing
  • Inline blocks

20. Developer Tools

07:15
  • Working with JavaScript
  • Local Development
  • Working with the Console
  • Mapbox GL JS API

21. Data Structures

07:15
  • JavaScript Fundamentals
  • Working with data values
  • Primitive data types
  • Arrays, Objects & Properties

22. Functions

07:15
  • Functions & parameters
  • Map methods
  • Callbacks & Event listeners
  • Map Click Interactions

23. Features Query

07:15
  • Querying the map features
  • Geometry and layer filters
  • Accessing features on click

24. Popup

08:24
  • The Popup Component
  • Displaying data in a popup
  • setHTML, setLngLat, addTo
  • Method chaining

25. Popup Styling

06:15
  • Dynamic Elements
  • Overwriting CSS properties
  • Styling the popup

26. Missing Data

07:15
  • The If statement
  • Logical OR & default values
  • Handling undefined values
  • Objects as dictionaries

27. Cursor & Navigation

07:56
  • Conditional Operator
  • Cursor styling & the cursor property
  • Mousemove Interactions

28. Git & Github

06:06
  • Sharing Files
  • Git Repositories, Push & Pull
  • Command Line Tools & GUI alternatives

29. Deployment

06:06
  • Pushing the project online
  • Setting up Github Pages
  • Using Github Desktop

30. Wrap-up

06:06
  • Summary
  • What`s next
  • Case Studies: Built Density, Sidewalk Cafes

The course contains over 100 beautifully illustrated slides covering both theory and practice — from land use mix to programming fundamentals.

Land Use Mix: Site Comparison

Land Use Mix

Lambert Conformal Conic Map Projection

Lambert Conformal Conic Projection

Design Principles — Types of Color Schemes

Types of color schemes

Tiled Maps

Tiled Maps

JavaScript Objects

JavaScript Objects

Function listeners

Function listeners

What you'll use


Throughout the course, you will use several free and open-source tools that will provide a solid base for your Mapping Data endeavours.

QGIS

QGIS

Mapbox Studio

Mapbox Studio

Mapbox GL JS

Mapbox GL JS

Developer Tools

Developer Tools

JavaScript

JavaScript

HTML

HTML

CSS

CSS

Git

Git

GitHub

GitHub

Visual Studio Code

VS Code

Mentions On Twitter


In the Media


Meet the Instructors


Morphocode

Morphocode is a creative studio specializing in data visualization and web mapping. The studio's work has been featured in the Best American Infographics and published extensively in popular media.

The course is designed, developed and taught by the studio founders — Greta and Kiril.

avatar

Greta

Greta is an architect and a designer, focusing on the use of urban data visualization as a tool for critical evaluation of active policies and city services.

avatar

Kiril

Kiril is an architect and a professional software developer. He crafts beautiful interactive experiences working across the entire web stack.

Get new skills


Data

Data Exploration

Geospatial data, Common File formats, Open data, Datasets

Web Mapping

Web Mapping

Tiled Maps, Vector Tiles, Data-Driven Styling, Tilesets, Zoom Functions

Map Design

Cartography & GIS

Map Projections, Coordinate Reference Systems, Features & Attributes

Information Design

Information Design

Color schemes, visual variables, Data Types, Data Encoding

UX

Interaction

User Experience, UI Layout variations, Custom Map Interactions

Publishing

Web Development

HTML, CSS, JavaScript, Developer Tools, Git, Github Pages, Deployment

30 Full HD Videos

Over 4 hours of content available for streaming and download

Additional Resources

A curated list of additional resources for further reading

Project Files

Source code and completed project files

Free Updates

Unlimited free updates of the video content

Support

Ask questions and get help along the way

Practical Skills

Learn tools, workflows and best practices for mapping data

Students are entitled to a 30% discount off the course price.

Learn More

Single User

$229
Get Course

EU customers: price excludes VAT

Is this suitable for me?

The course is suitable for architects, urban planners, designers, web developers, GIS users, journalists and data enthusiasts.

If you are genuinely interested in mapping, open data and the urban environment and you have a taste for coding - the content is suitable for you.

Do I Need Previous Knowledge on the topic?

This course covers the fundamentals of mapping urban data and was designed with the beginner in mind. It does not assume previous knowledge on the topic.

While previous experience with GIS tools, web mapping and coding skills will certainly help, it is not a prerequisite.

How do I watch the Videos?

Once you enroll in the course, you will be able to stream or download the videos for off-line viewing and work through the content at your own pace — whenever and however you want. All the videos were recorded at 1920×1080 with high quality audio.

What if I'm not satisfied?

We've put a lot of work in the course and we want you to be satisfied with your learning experience. If that's not the case you need to contact us within 10 days of your purchase. We will send you a feedback form to complete, so we can assess what needs to be improved.

Do You offer student discounts?

Yes. Students are entitled to a 30% discount off the regular course price. Please, send us an email from a valid student email (or attach a student id) and we will send you a discount code.

I have another question!

Sure - email us at contact@morphocode.com or feel free to tweet us with more questions at @morphocode.